An alert was thrown for high response time thresholds being surpassed with one of our services calling another on the same network. We've had no new code released for either service.
We utilize New Relic and DataDog monitoring.
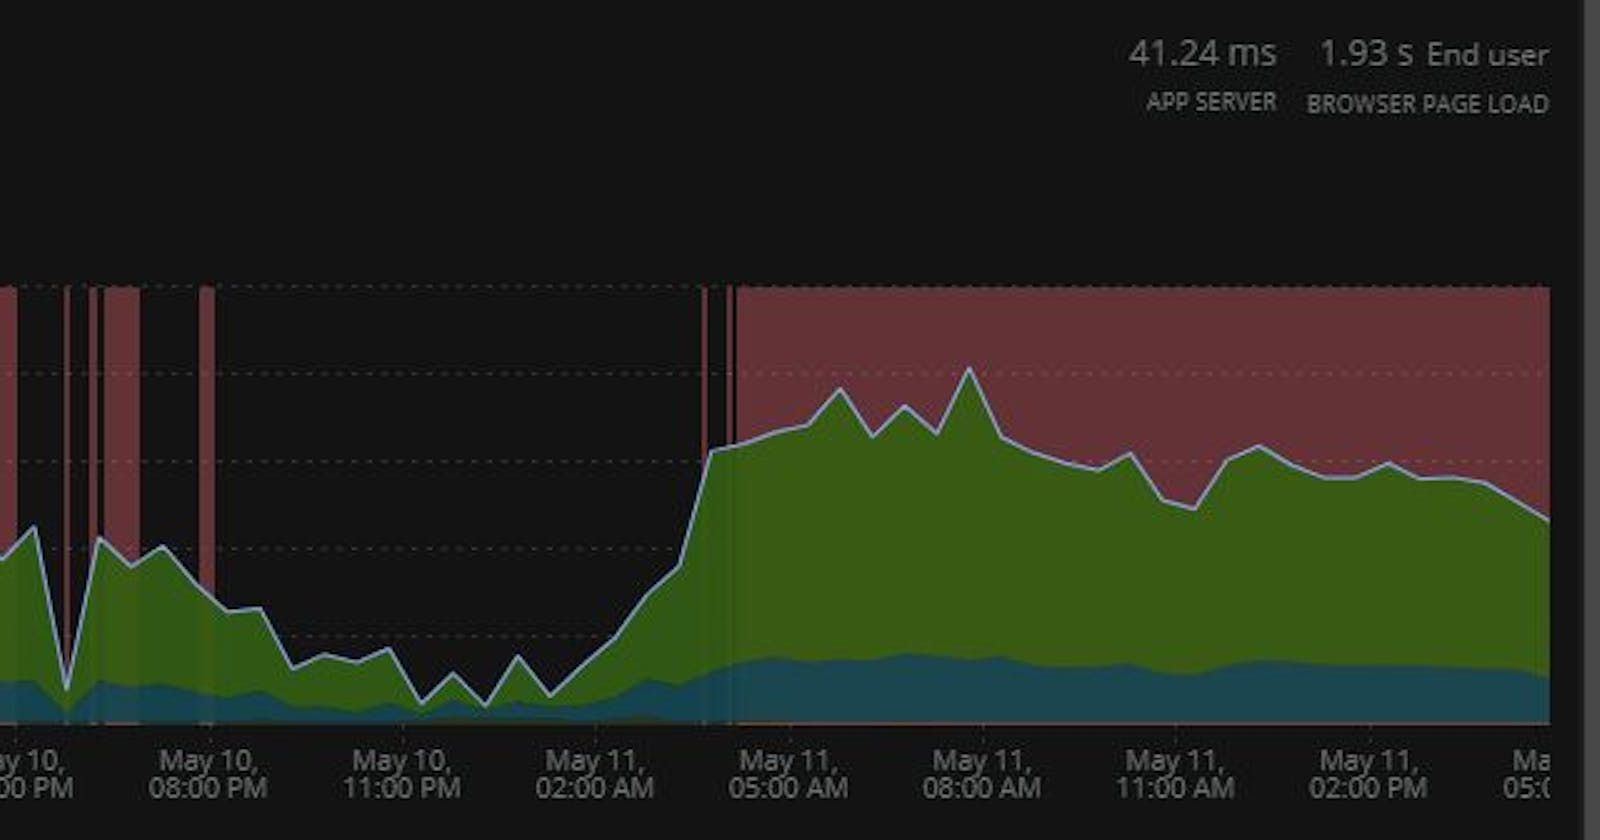
Here is a web transactions time showing higher than usual response times for service1 calling into service 2:

The peak response time normally is about 40-60ms. The peak response times now are about 200ms. Not terrible, but it's unusual. The two hosts do not have unusually high memory or CPU utilization. CPU utilization is lower than usual.
The Transactions show that the most time.
About 95% of the Most time-consuming calls for External services are to service2, but there is no deviation from the normal response time to this service:

The throughput is lower than usual which may be directly related to the higher response times.
Looking at the Web response time for service2, I see nothing out of the usual:

The database transactions and external service calls for service2 also seem within normal ranges.
EDIT
This leads me to suspect that there is something on the network causing higher-than-usual latency.
Here is a script that was run on the server to get an idea of the latency over time.
The network engineers were looped in to look for any issues since this is also a restricted environment. We continue to monitor.
