Investigate Slow SQL Queries and How to Potentially Workaround Them
Chunking/Partitioning

We recently had an issue with a null insert into a non-nullable column in some huge table on a production Azure SQL Server Hyperscale database.
Failure happend on 'Sink' side. ErrorCode=SqlOperationFailed, 'Type=Microsoft.DataTransfer.Common.Shared.HybridDeliveryException,Message=A database operation failed. Please search error to get more details.,Source=Microsoft.DataTransfer.ClientLibrary,''Type=System.InvalidOperationException,Message=Column 'Code' does not allow DBNull.Value.,Source=System...
Essentially, an Azure Data Factory pipeline was failing when to the copy from one database table to another. The pipeline is parsing a source table column that contains JSON into a specific column in the destination table. Fun note: The pipeline status shows up as successful if the last step in the pipeline succeeds. This makes it hard to know if there was a failure in one of the intermediate steps.
A query similar to this was used to try to find the problematic rows:
SELECT TOP(100) *
  FROM [dbo].[Events] WITH (NOLOCK)
  WHERE CreateDate >= CONVERT(datetimeoffset, '2023-04-06') AND CreateDate <= CONVERT(datetimeoffset, '2023-04-07')
  AND EventType = 'Approval'
  AND JSON_VALUE(EventObject, '$.Items[0].Nested.Code') IS NULL
Notice the WITH (NOLOCK) to allow for dirty reads since I don't want to possibly deadlock anything in production. This query ran for ~20 minutes before I canceled it. Running a query to just get the count for the date range returned pretty quickly:
SELECT COUNT(*)
  FROM [dbo].[Events] WITH (NOLOCK)
  WHERE CreateDate >= CONVERT(datetimeoffset, '2023-04-06') AND CreateDate <= CONVERT(datetimeoffset, '2023-04-07')
  AND EventType = 'Approval'
The count was 6415682. That's a lot of rows for the day so far.
Is the column in the where clause indexed?
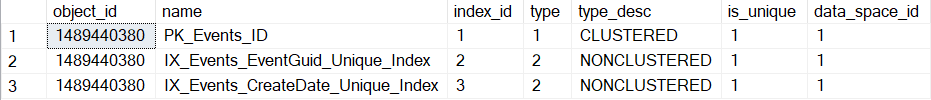
I checked to see if there was an index on the CreateDate column. The index should non-clustered since the Id column is a primary key (default clustered index) as well as an identity column. There can only be one clustered index per table. Having an index will allow for faster lookup since it's essentially a pointer to the data specified by the column. It can slow down any inserts and updates as it would require updating the index.
SELECT * FROM sys.indexes
WHERE object_id = (SELECT TOP(1) object_id FROM sys.objects WHERE name = 'Events')
To confirm that the name corresponds to the stated columns:
EXEC sp_helpindex 'Events'
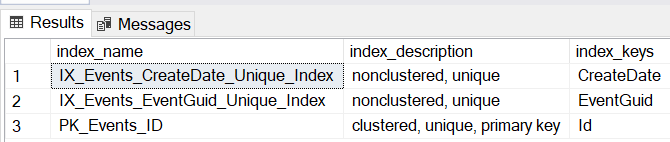
Yup, CreateDate has a non-clustered index. However, there is no index for EventType. I wouldn't expect table scans to be a slow down here.
Other causes?
It would take too long to rebuild the indexes and we just want to find the offending rows. The parsing of the EventObject field from JSON can't help performance. Even with using a schema specified the performance is still bad:
SELECT TOP(100) p.Id, js.*
FROM [dbo].[Events] p WITH (NOLOCK)
CROSS APPLY OPENJSON(p.EventObject) WITH (
    code varchar(100) '$.Items[0].Nested.Code'
) js
WHERE CreateDate >= CONVERT(datetimeoffset, '2023-04-07') AND CreateDate <= CONVERT(datetimeoffset, '2023-04-08')
AND EventType = 'Approval' AND code IS NULL
And this is worse and doesn't take into account that the property itself is missing and only "code": null or "code": "".
SELECT TOP(100) *
  FROM [dbo].[PosBasketEvents] WITH (NOLOCK)
    WHERE CreateDate >= CONVERT(datetimeoffset, '2023-04-07') AND CreateDate <= CONVERT(datetimeoffset, '2023-04-08')  and EventType = 'Approval'
  AND EventObject LIKE '%"code":""%' OR EventObject LIKE '%"code": null'
Looking at the execution plan from right to left, we can see the width of the arrow of the Index Seek relating to the CreateDate column. The bulk of the data is coming from this retreival as indicated by the arrow size compared to the Key Lookup with Id column. Here is an execution plan for running with parameters with a time range of 00:00:00 to 04:00:00 for the same day:
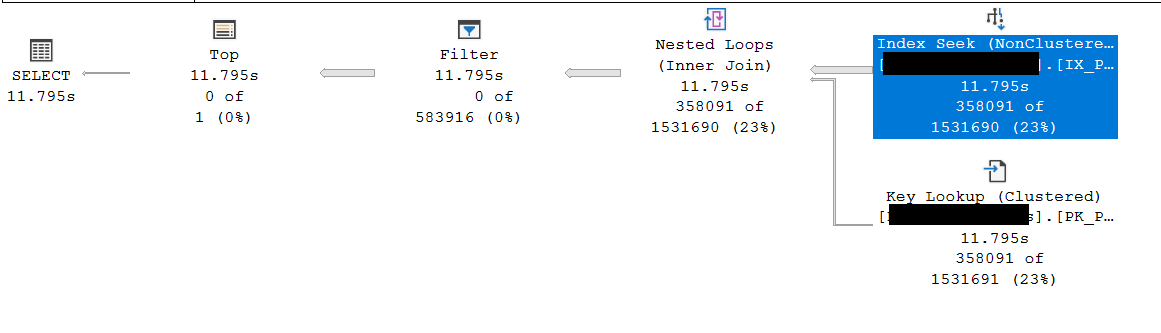
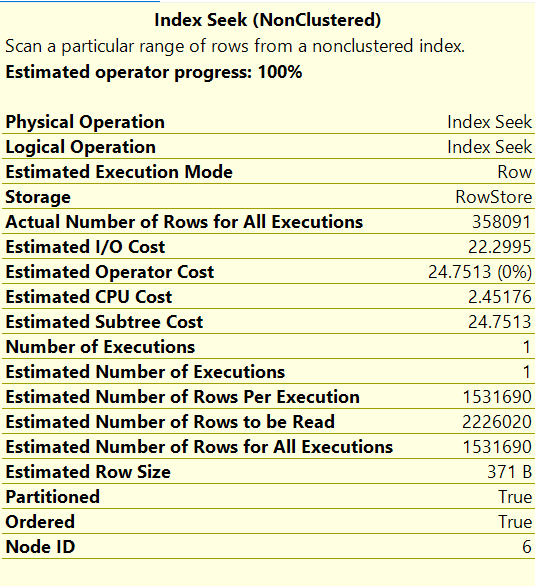
Here are some details on that node when we hover the mouse across it the details can also be accessed in a separate pane with F4 key. Note the relative costs for each of the nodes (23%). Cropped for security:
From what I gather, Nested Loops node is related to some sort of prefetching with TransactionTime column. Normally, I would expect to see this in an inner join.

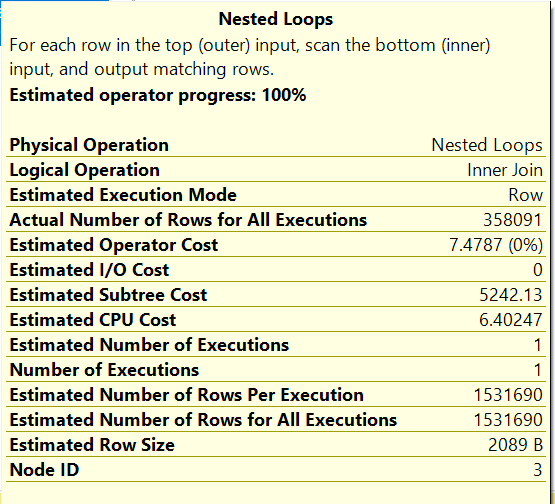
Note that the estimated rows and the actual rows are orders of magnitude off which doesn't bode well upstream to the other nodes. No warnings in these details either nor any additional index recommendations. Since running the original query never finishes we can take a look at the Live Query Statistics as we run that long-running query over time to get an idea of where the slow down is over time. The estimated execution plan can be useful as well. Be cognizant of any caching that may happen to the execution plan which might change based on the filter criteria, like CreateDate and EventType.
Using the sp_spaceused sproc:
sp_spaceused 'Events'

Brah, that table is taking up ~13 Terabytes and has 6436148682 rows...
The size limit for an Azure SQL Server Hyperscale instance is 100TB.
Taking a look at the details of the index for CreateDate itself:

The total fragmentation is 9.84% which isn't bad on a small table, but on a large table, that is no good. This query using sys.dm_db_index_physical_stats would help track down other tables that have fragmented indexes.
SELECT OBJECT_NAME(IDX.OBJECT_ID) AS Table_Name
    ,IDX.name AS Index_Name
    ,IDXPS.index_type_desc AS Index_Type
    ,IDXPS.avg_fragmentation_in_percent Fragmentation_Percentage
FROM sys.dm_db_index_physical_stats(DB_ID(), NULL, NULL, NULL, NULL) IDXPS
INNER JOIN sys.indexes IDX ON IDX.object_id = IDXPS.object_id
    AND IDX.index_id = IDXPS.index_id
ORDER BY Fragmentation_Percentage DESC
We probably want to rebuild this index or at a minimum reorganize it, but not today since it could take a while and change management approval would be required.
Microsoft recommends: That indexes be rebuilt if the fragmentation is over 30% and reorganized if the fragmentation is between 5 and 30%. Reorganizing an index is a faster, lightweight version of rebuilding and the indexes remain online.
I just want to find those rows...
Workaround
I tried smaller time ranges with an hour interval to see how long the query would take:
SELECT TOP(100) *
  FROM [dbo].[Events] WITH (NOLOCK)
  WHERE CreateDate BETWEEN CONVERT(datetimeoffset, '2023-04-07 00:00:00') AND CONVERT(datetimeoffset, '2023-04-09 01:00:00')
  AND EventType = 'Approval'
  AND JSON_VALUE(EventObject, '$.Items[0].Nested.Code') IS NULL
I didn't get results, but the query was executed in a few seconds. Trying the next hour range, also yielded no results, but it also took a few seconds. Eventually, I was able to find the offending rows between the 12:00:00 and 23:00:00. That took about ~5 minutes to run.
Here is a query that will chunk up a date range with a specified interval (1 hour stated below) as a common table expression (CTE) and then run the query dynamically based on those date ranges. If I didn't run the query dynamically we wouldn't see the same performance as above. It seems that the SQL Execution Plan generated would be similar to running it for unpartitioned start and end date-times. Note, think twice before running dynamic SQL. It's safe in this context since I'm running it ad-hoc and not part of a service.
Warning it is hacky:
Test
Create a table and data below to test the partitioning/chunking logic. Try online.
Create Table
CREATE TABLE [dbo].[Events](
    [Id] [bigint] IDENTITY NOT NULL,
    CONSTRAINT [PK_Events_ID] PRIMARY KEY CLUSTERED ([Id] ASC),
    [OrderId] [nvarchar](128) NOT NULL,
    [EventGuid] [uniqueidentifier] NOT NULL,
    [EventType] [nvarchar](128) NOT NULL,
    [EventSource] [nvarchar](128) NOT NULL,
    [TransactionTime] [datetimeoffset](7) NOT NULL,
    [EventObject] [nvarchar](max) NOT NULL,
    [IsDeleted] [bit] NOT NULL,
    [CreateDate] [datetimeoffset](7) NOT NULL,
    [ModifyDate] [datetimeoffset](7) NOT NULL
)
GO

ALTER TABLE [dbo].[Events] ADD CONSTRAINT [DF_Events_CreateDate] DEFAULT (getutcdate()) FOR [CreateDate]
GO

ALTER TABLE [dbo].[Events] ADD CONSTRAINT [DF_Events_ModifyDate] DEFAULT (getutcdate()) FOR [ModifyDate]
GO


CREATE UNIQUE INDEX IX_Events_EventGuid_Unique_Index ON [dbo].[Events] (EventGuid);
CREATE UNIQUE INDEX IX_Events_CreateDate_Unique_Index ON [dbo].[Events] (CreateDate);
Insert Data
INSERT INTO [dbo].[Events] (
    OrderId
    ,EventGuid
    ,EventType
    ,EventSource
    ,TransactionTime
    ,EventObject
    ,IsDeleted
    ,CreateDate
    ,ModifyDate
    )
VALUES (
    'ABC'
    ,NEWID()
    ,'Approval'
    ,'YOUR_MOM'
    ,'2023-03-30 03:02:41.0000000 +00:00'
    ,'{"DateTime": "01-01-2023", "Firstname": "Jeff", "Lastname": "Test", "Items": [{ "ItemNumber": 123, "Nested": {"Code": "XYZ" }}] } '
    ,0
    ,GETUTCDATE()
    ,GETUTCDATE()
)
TLDR
Queries are long-running even when there are indexes on where clause columns. Narrow down the search space.

References
https://learn.microsoft.com/en-us/sql/t-sql/functions/json-value-transact-sql?view=sql-server-ver16
https://solutioncenter.apexsql.com/why-when-and-how-to-rebuild-and-reorganize-sql-server-indexes/
https://bertwagner.com/category/sql/performance-tuning/execution-plans/page/2/
https://dba.stackexchange.com/questions/4283/when-should-i-rebuild-indexes


