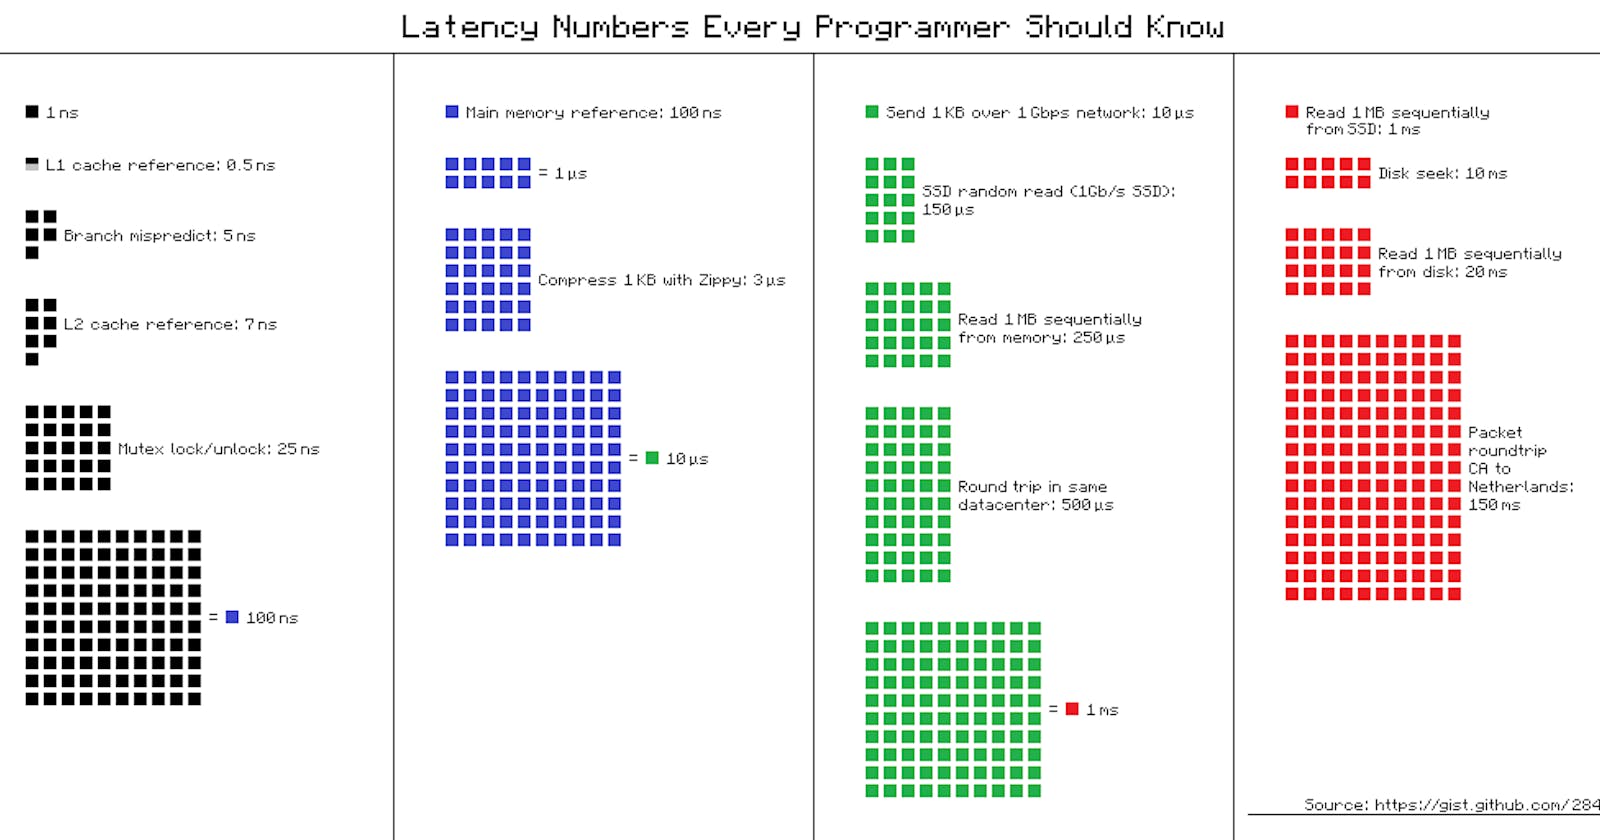
Was watching a series from Big Data Analysis with Scala and Spark and the video about latency led me down a rabbit hole. I had first seen this break down from System Design Interview by Alex Xu. These values estimated/adjusted from Colin's Scott's Interactive Latency:
L1 cache reference                           ~0.5-1 ns
Branch mispredict                            ~3   ns
L2 cache reference                           4   ns                      14x L1 cache
Mutex lock/unlock                           17   ns
Main memory reference                      100   ns                      20x L2 cache, 200x L1 cache
Compress 1K bytes with Zippy             3,000   ns        3 us
Send 1K bytes over 1 Gbps network       10,000   ns       10 us
Read 4K randomly from SSD*             150,000   ns      150 us          ~1GB/sec SSD
Read 1 MB sequentially from memory     250,000   ns      250 us
Round trip within same datacenter      500,000   ns      500 us
Read 1 MB sequentially from SSD*     1,000,000   ns    1,000 us    1 ms  ~1GB/sec SSD, 4X memory
Disk seek                           10,000,000   ns   10,000 us   10 ms  20x datacenter roundtrip
Read 1 MB sequentially from disk    20,000,000   ns   20,000 us   20 ms  80x memory, 20X SSD
Send packet CA->Netherlands->CA    150,000,000   ns  150,000 us  150 ms
The scale can be conceptualized in terms of time with this gist from hellerbarde.
I wanted to adapt this data so that it can be groked visually with scale.
TODO: Better visuals with dynamic calculations. Currently adapted from Odds of Dying and Winning Mega Millions Lottery
Credit
- Originally by Peter Norvig: norvig.com/21-days.html#answers
- Jeff Dean: research.google.com/people/jeff
